Dynamically generate images
Build your own Spotify Wrapped for your app. Go from a Figma design exported as SVG to auto generated images injected with your user's data. This can be great tool for creating engagement for your app on social media, image sharable user images such as Spotify wrapped, wordle scorecard, strava stats etc. With Rowy, you can build this in just 10 minutes.
What you’ll need
- If you don't have a Rowy account, create one first and then create a new project.
- Create a table containing the user data to be injected into the image template. This can be simple like this demo table.
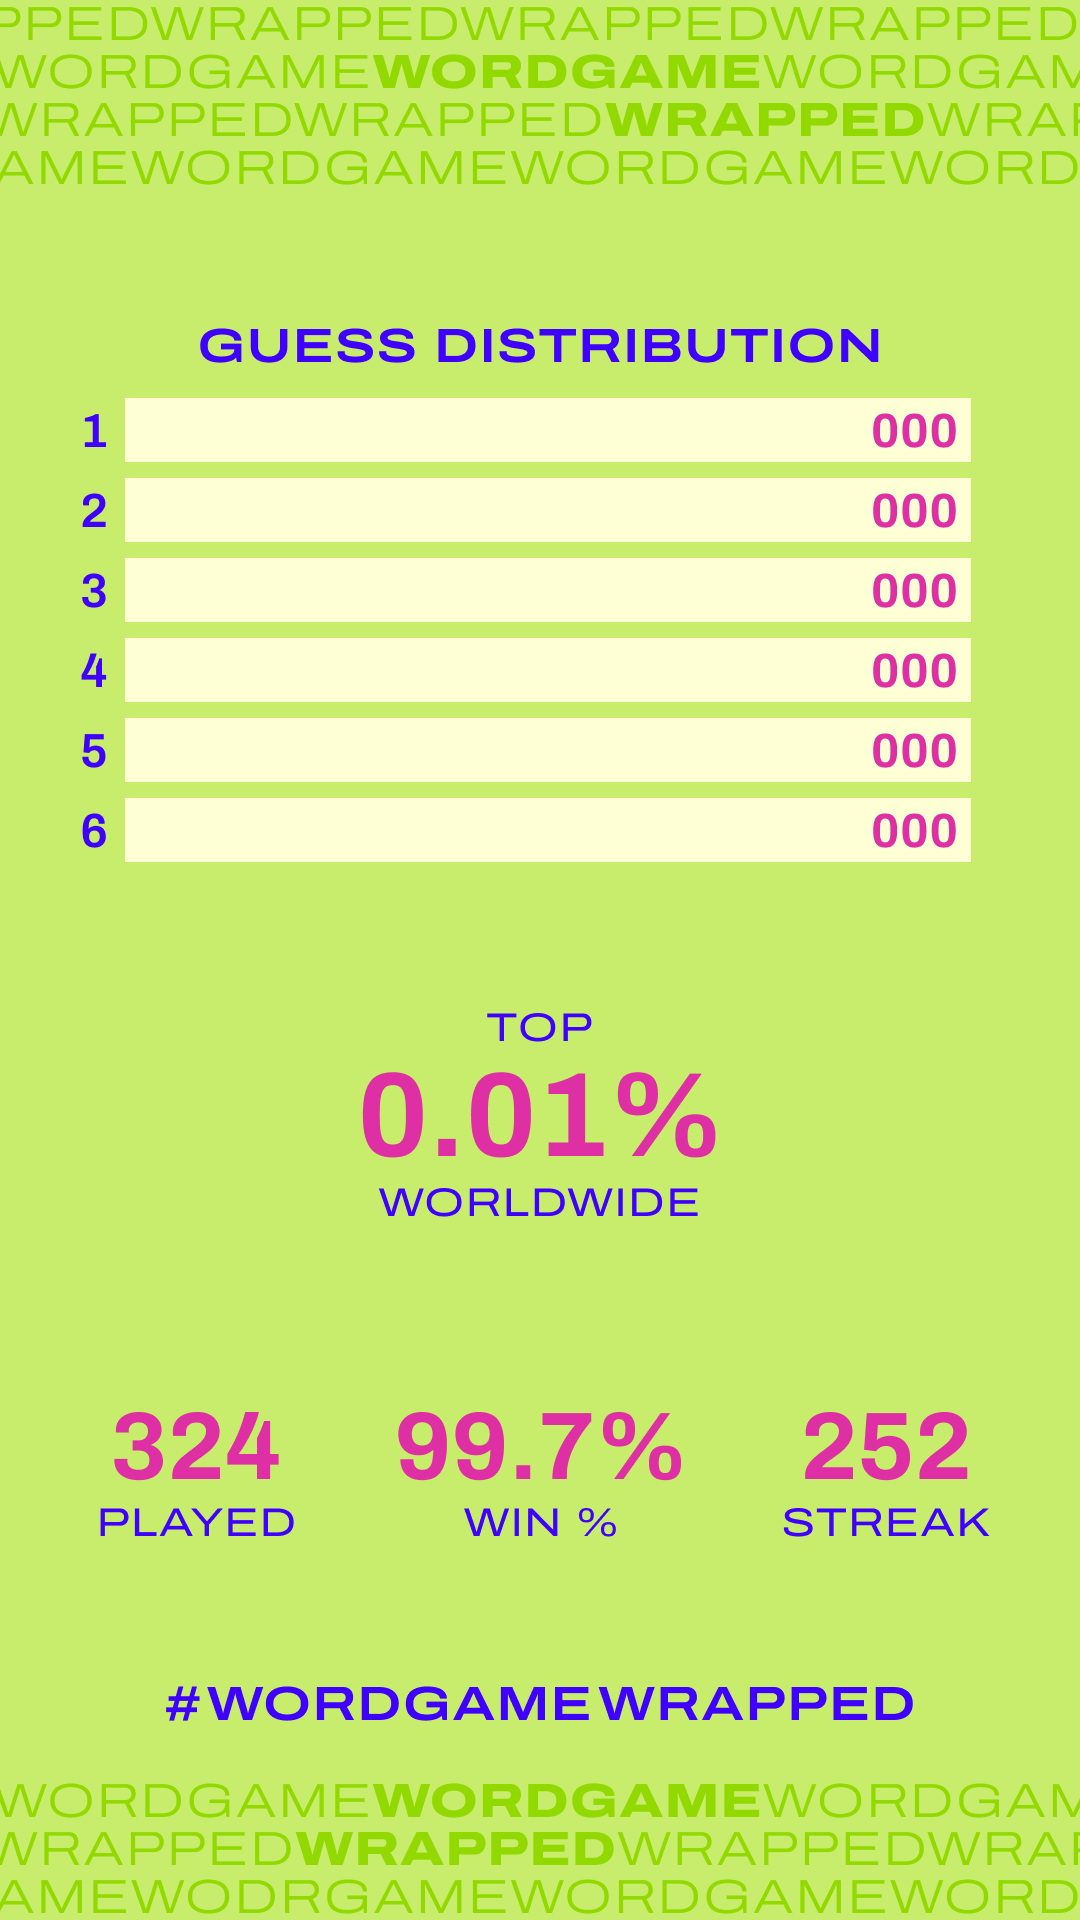
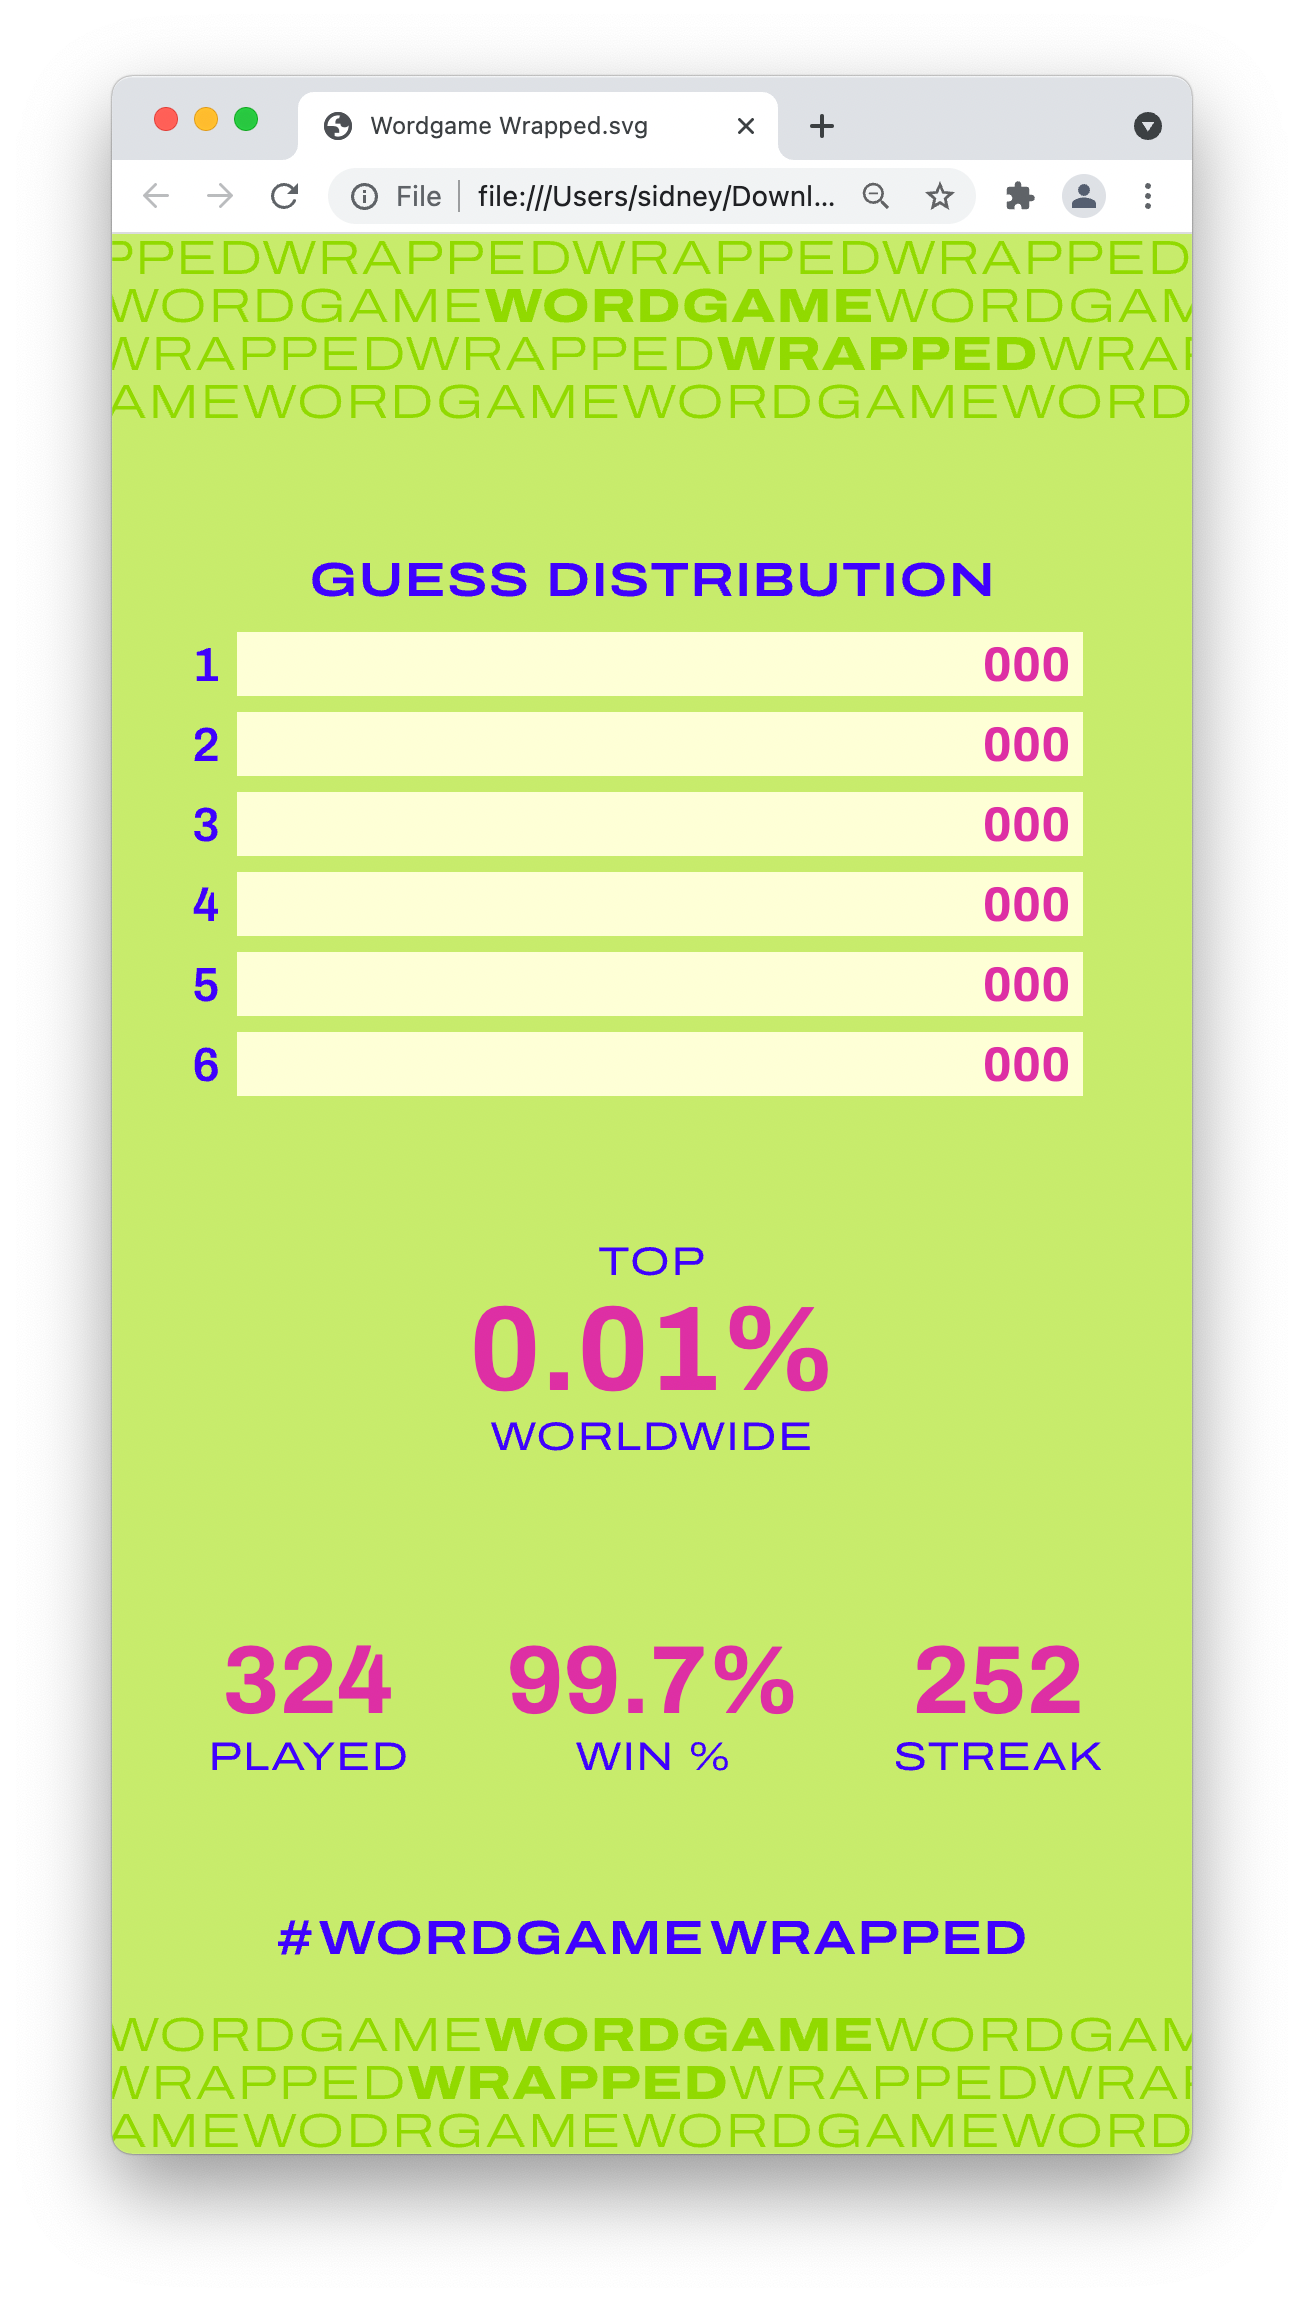
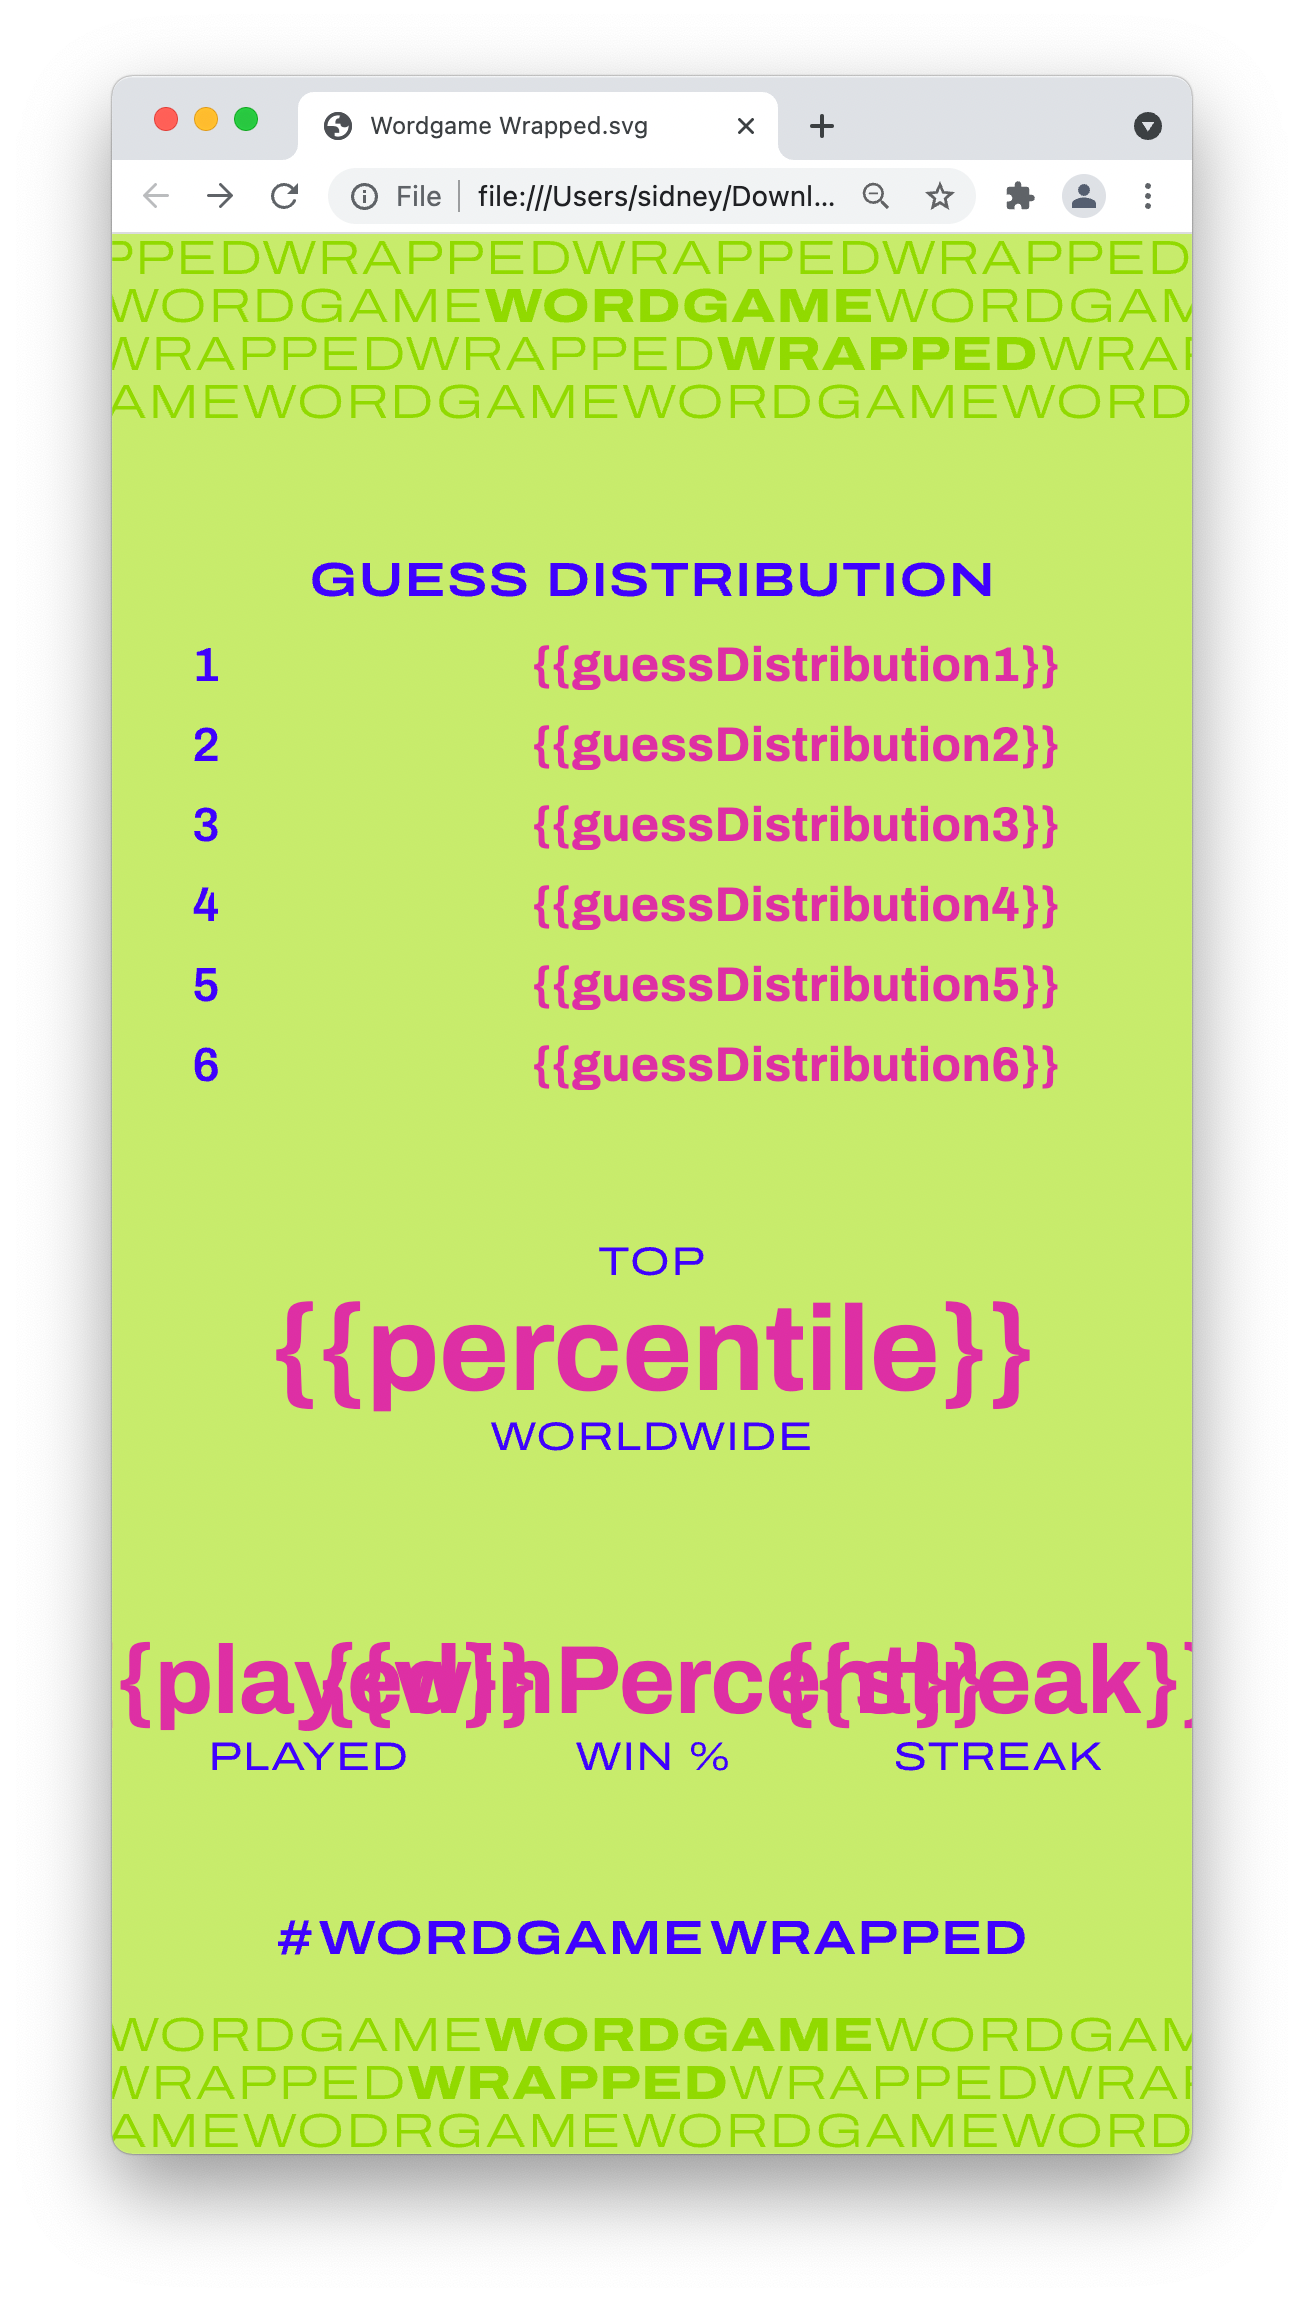
- Design an image template in Figma, like this:
Step 1: Export and test the SVG
We’re using SVG because it encodes designs in plain text, and that can be really easily manipulated to add the user’s data.
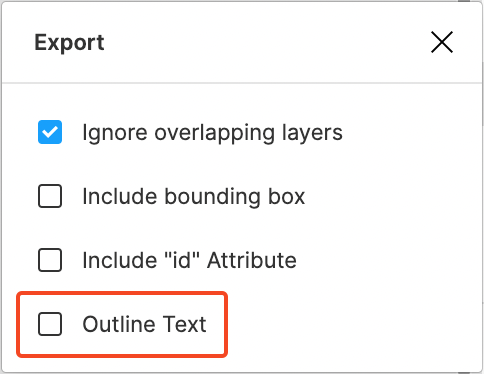
Export your template as an SVG, making sure to de-select Outline Text so we can edit the text later. If you have text that stays static, right-click the text layer and click Outline stroke. This means we won’t have to worry about finding the fonts for those layers later.
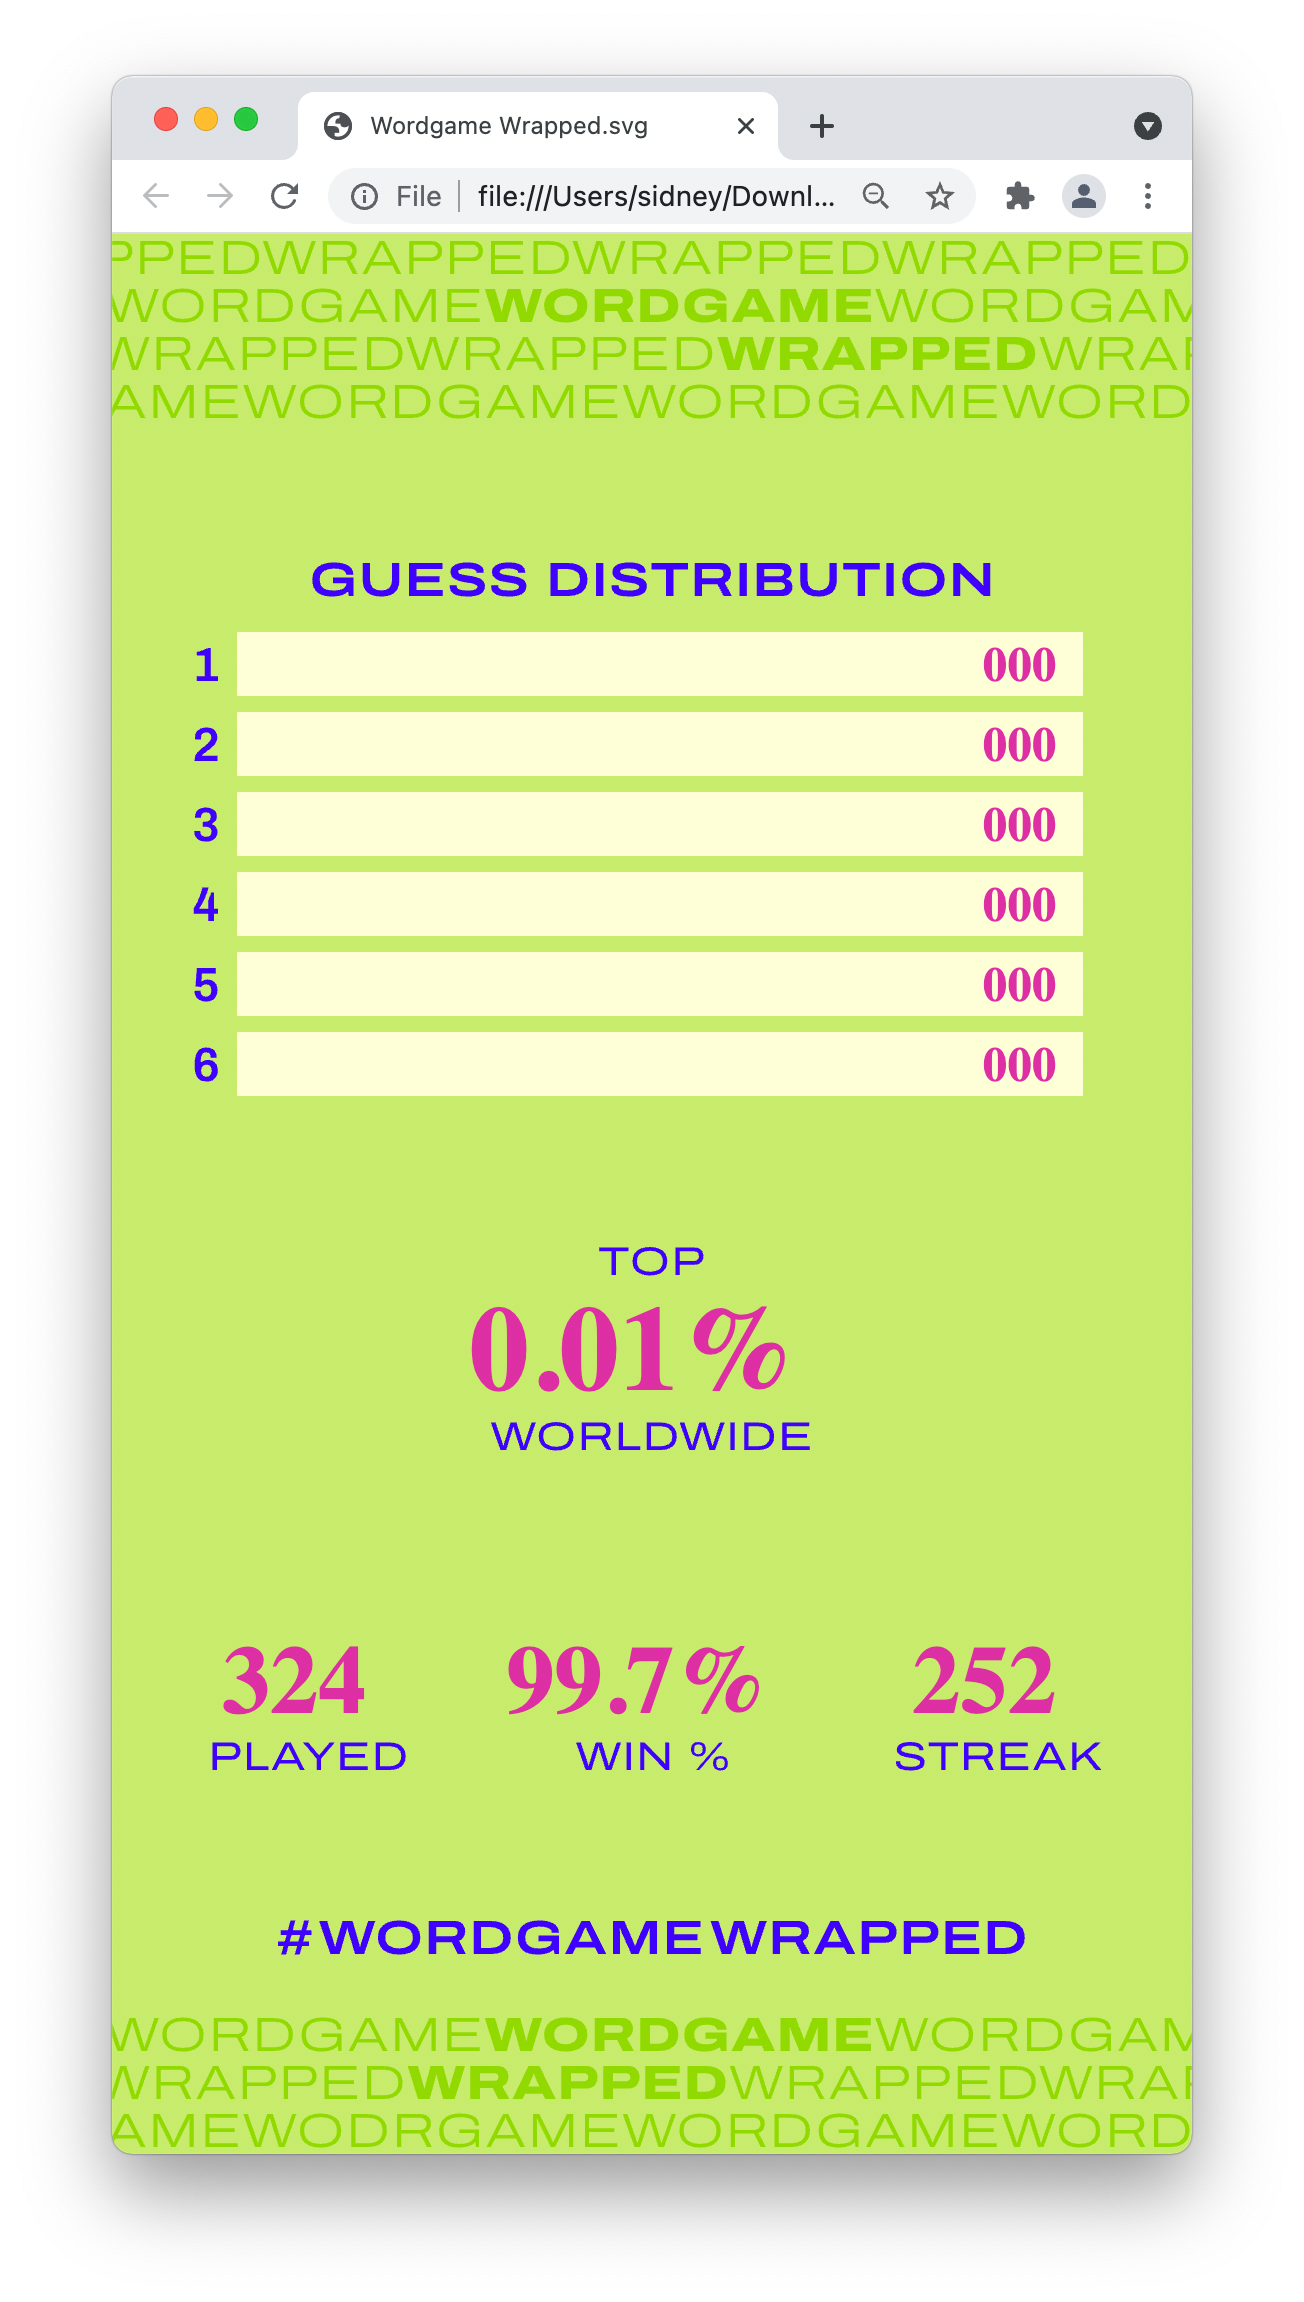
Open the SVG file in a browser. We’ll be using Puppeteer, which runs a headless version of Chrome, to render the SVG later, so a browser can accurately preview how it will look.
Your design likely uses custom fonts, so we’ll need to display them correctly. Since we’re using a browser to render this and SVG supports CSS, we can use web fonts. Open your SVG in a text editor like VS Code.
This design uses Archivo from
Google Fonts, so we can copy the code snippet they provide. Add it to the SVG
file, right after the opening <svg ... > tag.
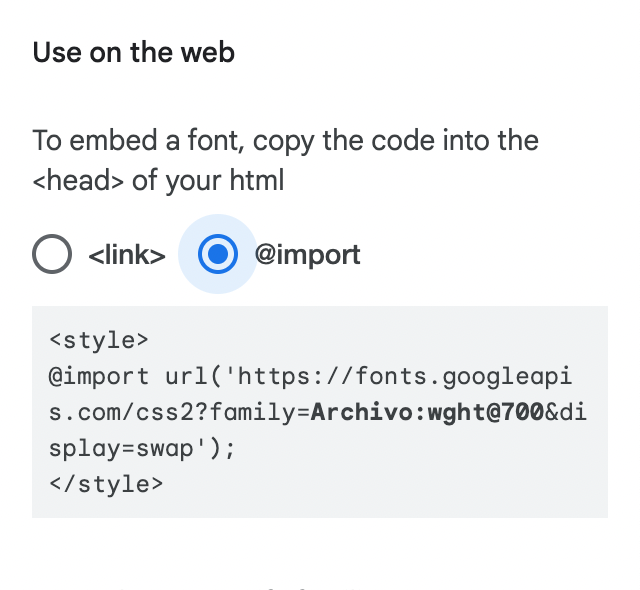
You’ll need to modify the URL to remove everything after the & character to
make it display:
<style>
  @import url("https://fonts.googleapis.com/css2?family=Archivo:wght@700");
</style>
Here’s how it looks with all the fonts available:
Step 2: Add variables to the SVG
We’re going to do a basic string replacement to inject user data into the design. Let’s change the text now to make it easier to find and replace later.
In your text editor, find the 0.01% text and replace it with your variable’s
name. I’m using a double curly brace syntax common in email templates:
{{percentile}}.
When you reload the SVG in your browser, you should see it appear.
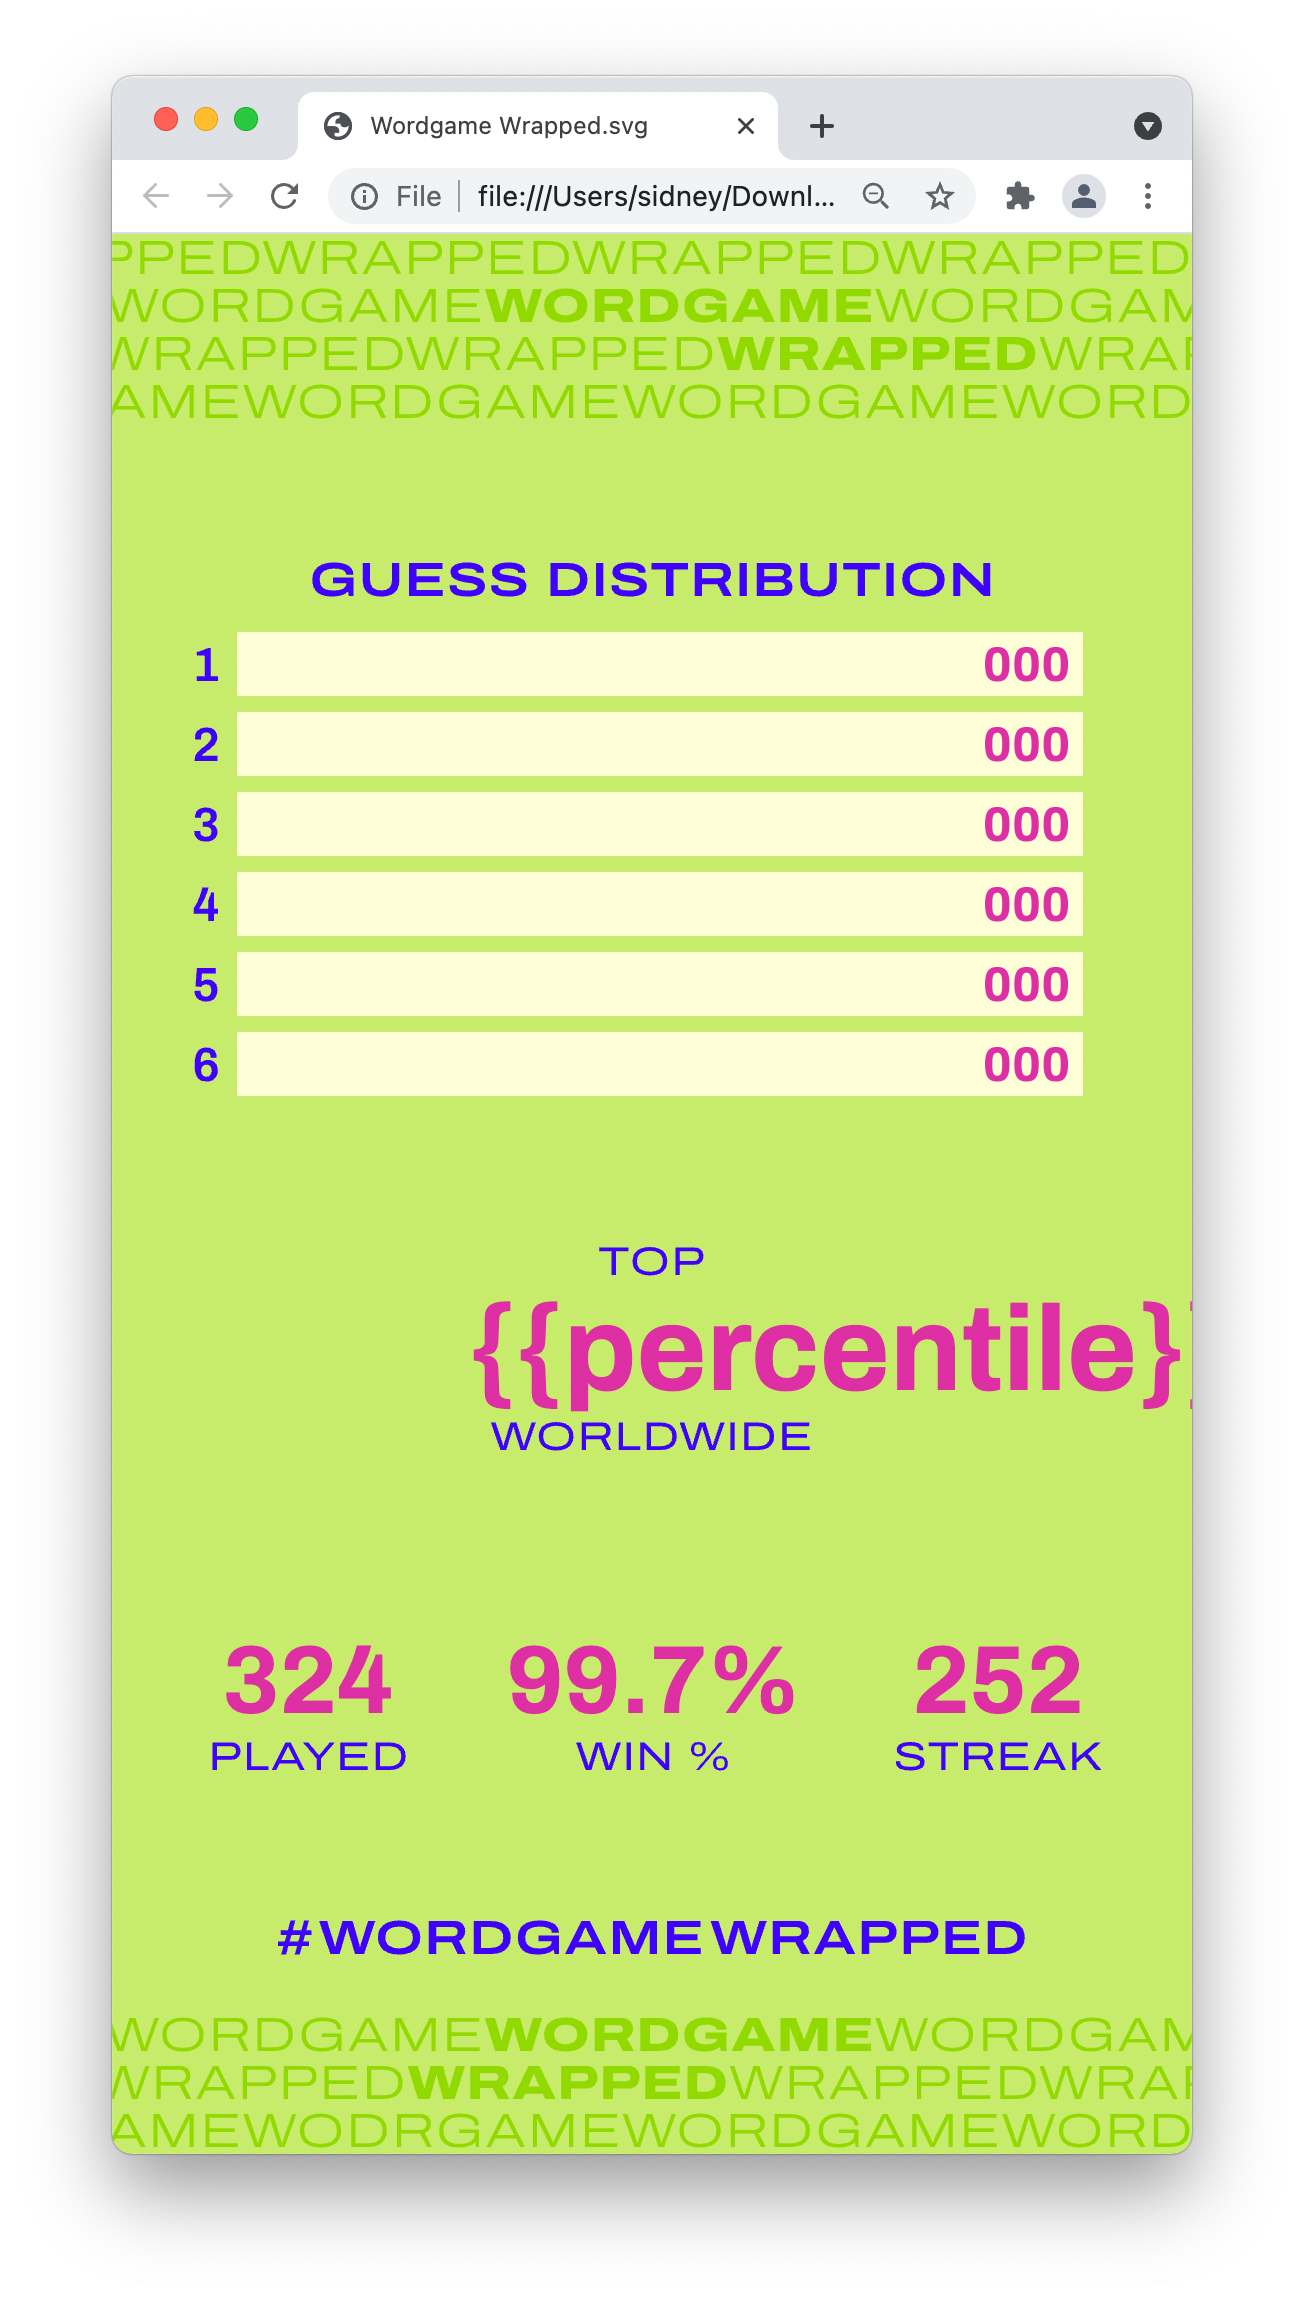
It looks like our text is misaligned. We want it to be centered right in the
middle of the screen. SVG has a [text-anchor
attribute](https://developer.mozilla.org/en-US/docs/Web/SVG/Attribute/text-anchor)
that does this. Let’s add the attribute text-anchor="middle" to that text
element we just edited.
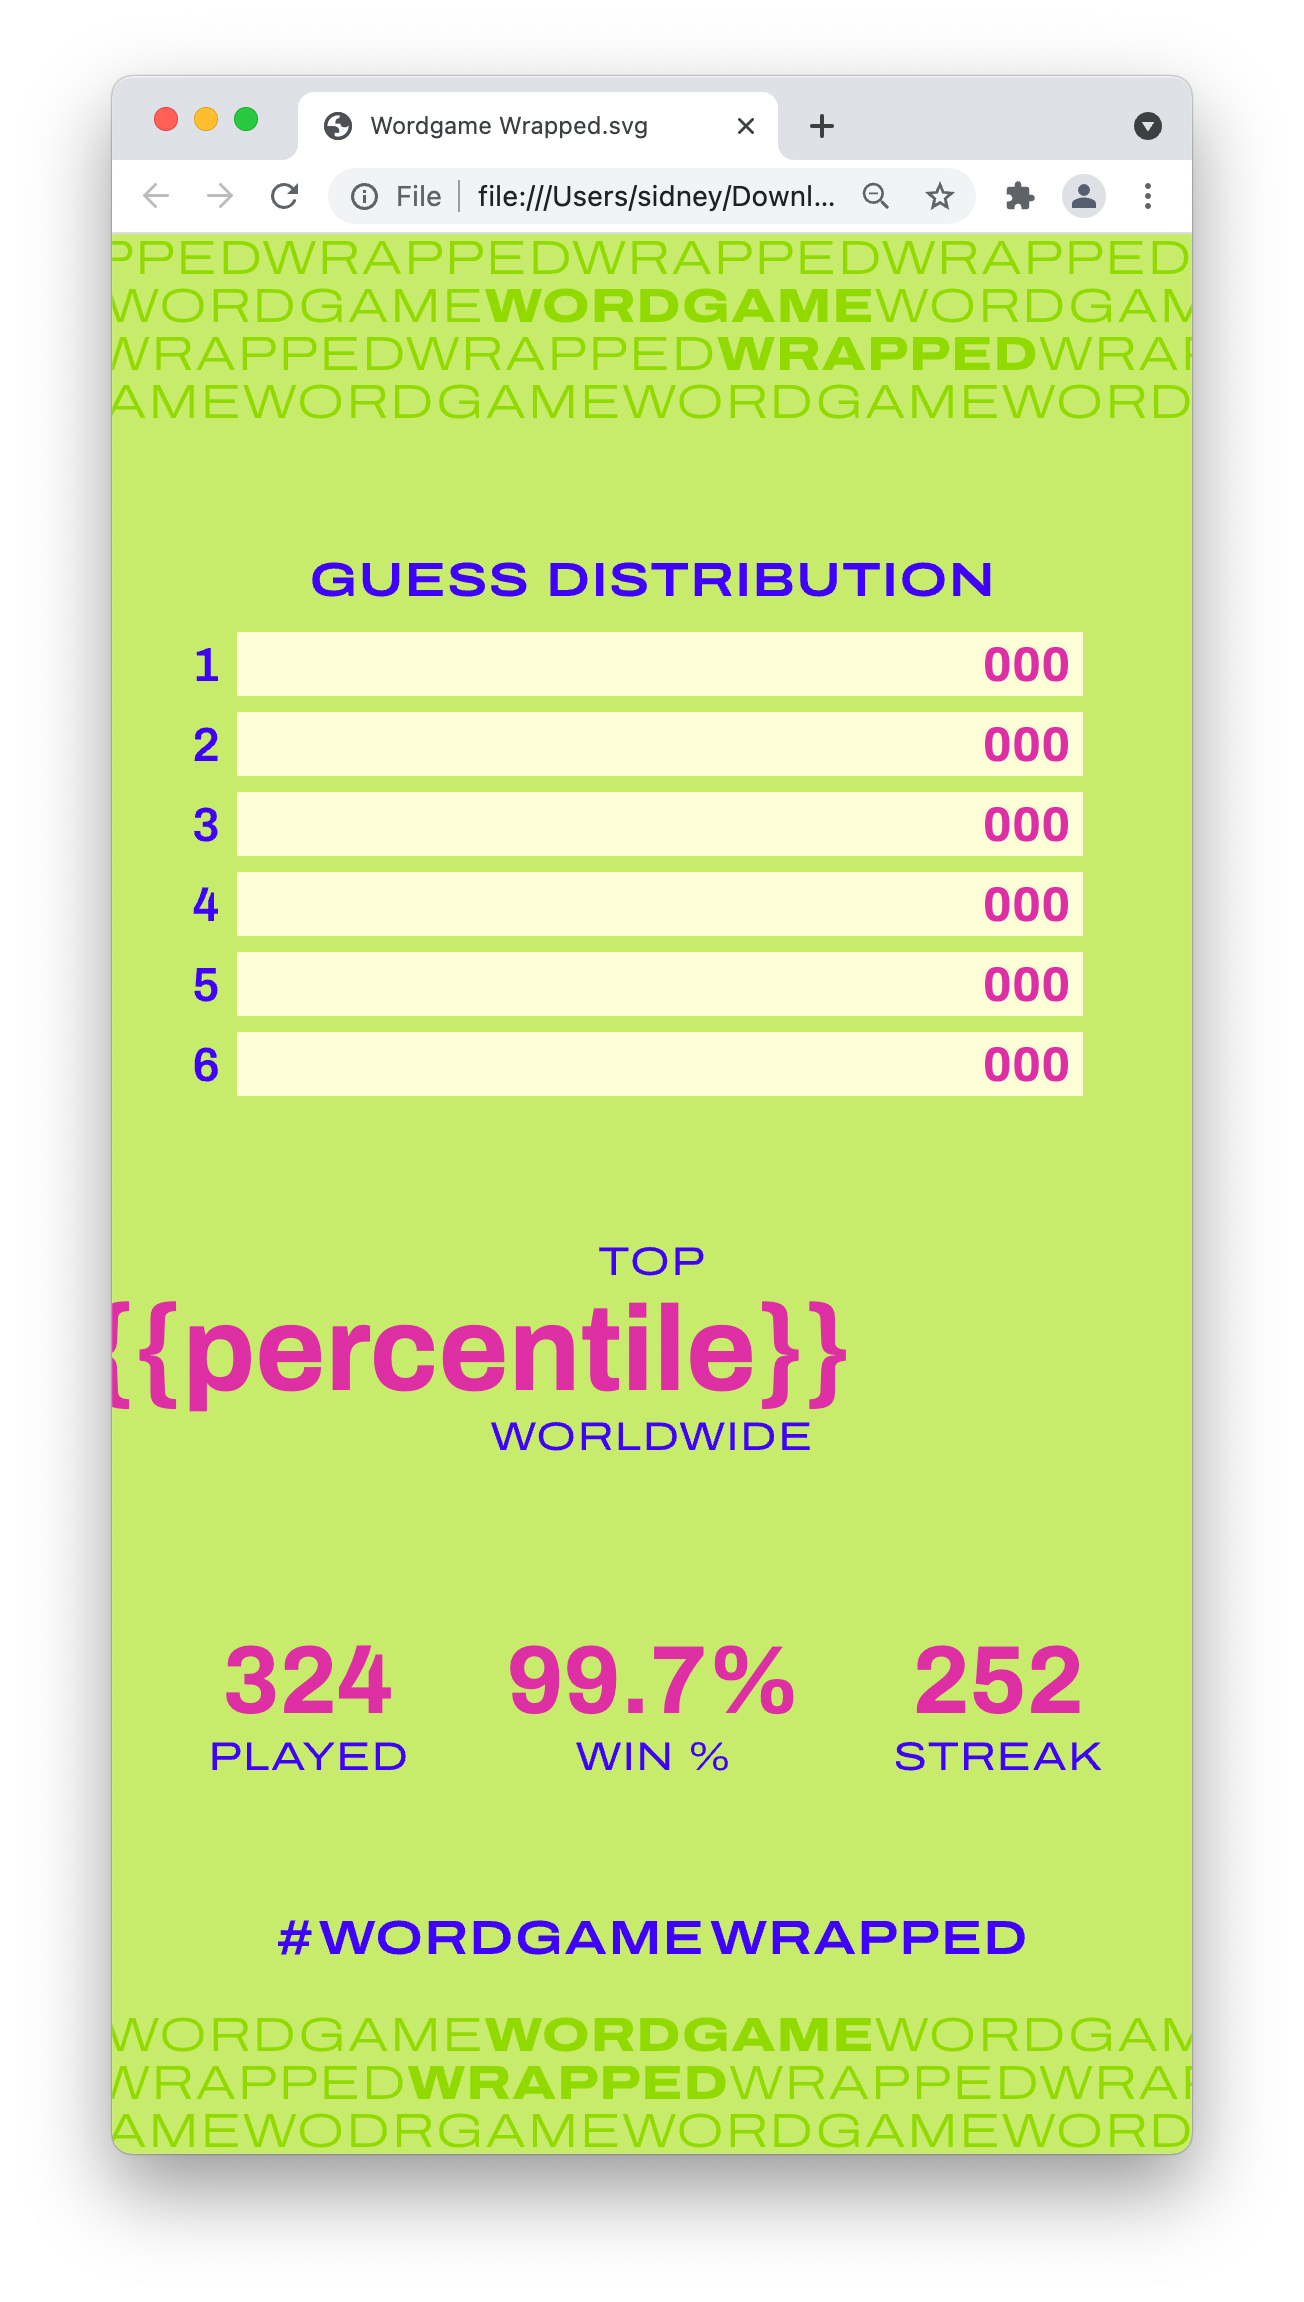
That still doesn’t look aligned correctly. It looks like it’s being centered
from the point where the left edge of the 0 character was before. We need to
get the midpoint of the text element.
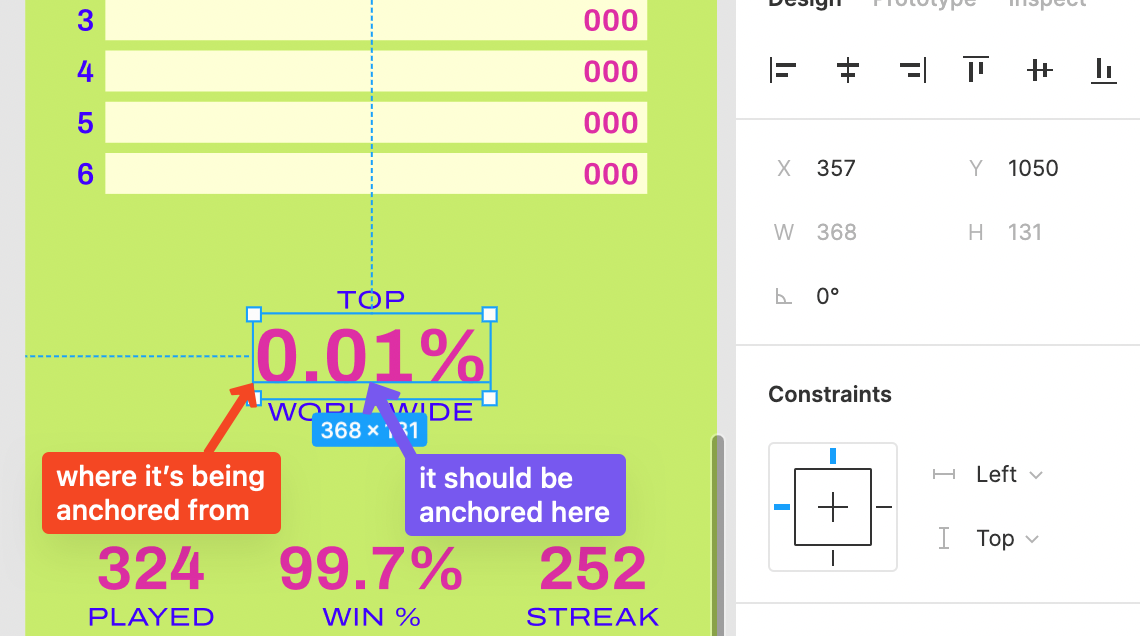
Let’s go back to Figma and get the coordinates. To get the midpoint, we need to
add half the width (368 / 2) to the X coordinate (357). So the correct anchor
point is X = 541. Let’s edit the x=" … " attribute in the corresponding
tspan element with this value.
Now that it’s aligned, we need to do the same for the rest of the variables.
We should also edit the bars’ width attributes so we can change them based on
the actual data: <rect x="125" y="398" width="{{guessWidth1}}”
The SVG will look a bit odd in your browser, so you can close the tab. Make sure you save your SVG file!
Step 3: Create a derivative column
Back in your Rowy table, add a new Derivative column. This field type runs a cloud function that you write whenever specific fields in a row are updated. We can use this to generate a new image when the stats change.
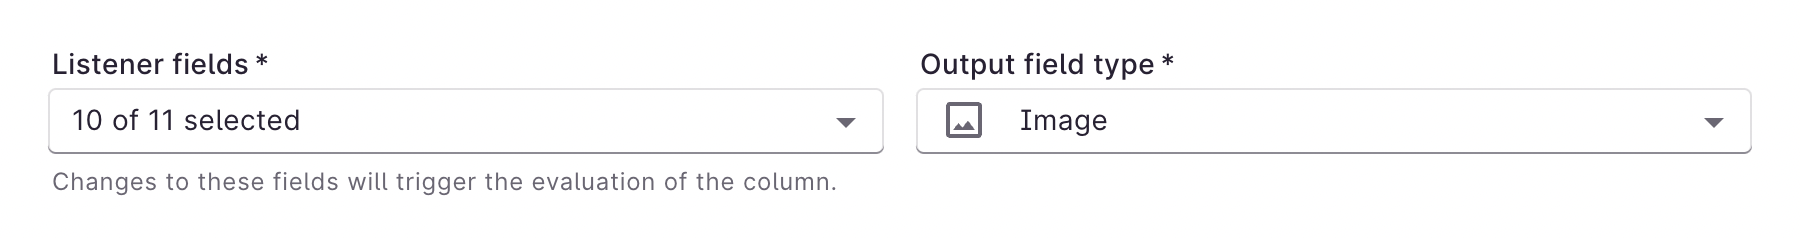
Set the Listener fields to the fields that contain the data we want in the image. And set the Output field type to Image to be displayed as a thumbnail in the table.
In the Derivative script, we’ll write some JavaScript code. This will be run in
an async function using Node.js when it’s deployed. Let’s store the SVG code
in a string variable:
const source = `<svg
...
</svg>
`;
Then, we can create a new string, replacing the placeholders we added in the
previous step with the row’s data. This is available in the row object, with
each field key being a property of that object.
const replaced = source
  .replace("{{percentile}}", `${row.percentile.toFixed(2)}%`)
  .replace("{{streak}}", row.streak.toString());
Repeat this for all of the variables. Make sure to convert any numbers to strings to prevent errors.
We can then perform the calculations for the bar widths. These will be proportional to the largest number in the data set of guess distributions. Here are the calculations:
const maxGuess = Math.max(
  row.guessDistribution1,
  row.guessDistribution2,
  row.guessDistribution3,
  row.guessDistribution4,
  row.guessDistribution5,
  row.guessDistribution6
);

...

// 846 is the max width of the bar, based on the Figma design
.replace("{{guessWidth1}}", (row.guessDistribution1 / maxGuess * 846).toString())
Step 4: Generate and upload the image
Next, let’s convert this to an image. We’re using the
[convert-svg-to-png](https://www.npmjs.com/package/convert-svg-to-png) NPM
package, which uses Puppeteer.
const { convert } = require("convert-svg-to-png");

...

const image = await convert(Buffer.from(replaced));
It returns a PNG as a buffer, stored in the image constant. We can then upload
this to Firebase Storage using this code:
const bucket = storage.bucket();
const fileName = `${ref.id}.png`;
const file = bucket.file(`dynamicImages/${ref.id}/generated/${fileName}`);
const uuid = require("uuid");
const token = uuid.v4();
await file.save(image, {
  metadata: {
    contentType: "image/png",
    metadata: { firebaseStorageDownloadTokens: token },
  },
});
Then, let’s store the URL to that image as the value of the derivative field in the row. This allows Rowy to display a thumbnail.
return [
  {
    downloadURL: `https://firebasestorage.googleapis.com/v0/b/${
      bucket.name
    }/o/${encodeURIComponent(file.name)}?alt=media&token=${token}`,
    name: fileName,
    type: "image/png",
    lastModifiedTS: new Date(),
  },
];

export default derivative;
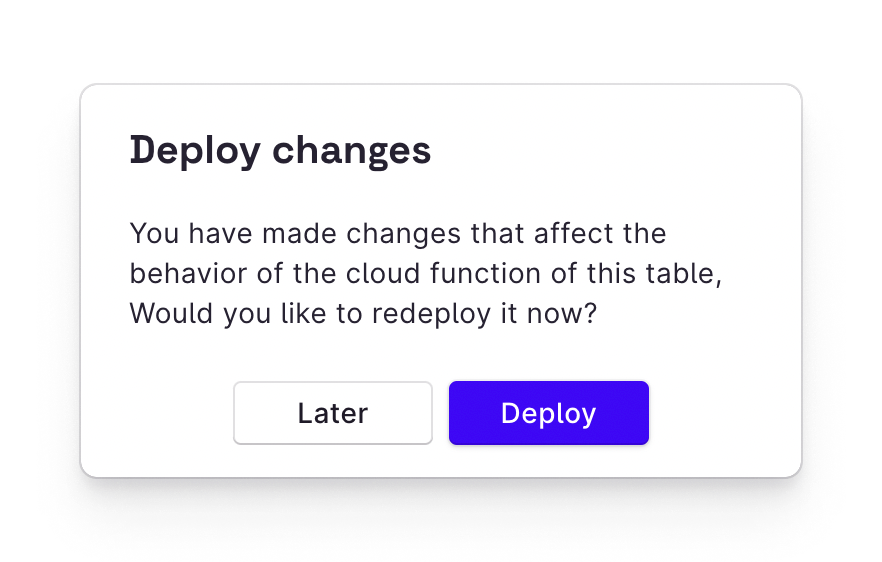
Our derivative script is complete! Click the Update button, then click Deploy in the following popup. (It may take a second or two to appear.)
Step 5: Increase RAM allocation
Next, we’ll need to increase the RAM allocation for the cloud function we just deployed. By default, it’s set to 256 MB, but this isn’t enough to run Chromium.
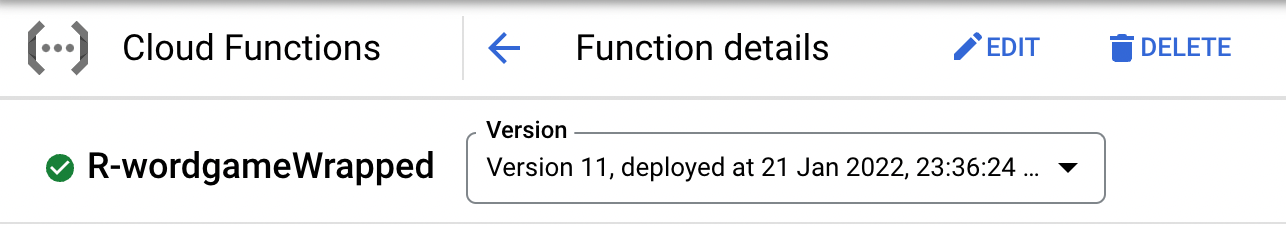
Open the Google Cloud Console to the
Cloud Functions page and find
the function you just deployed it should start with R- and match the
collection name of the table. Go to that function’s page.
On the top of the screen, click Edit.
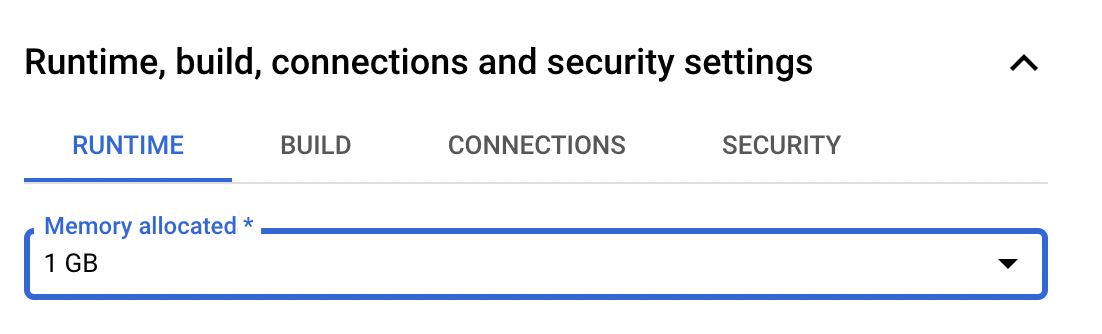
Scroll down to Runtime, build, connections and security settings and expand the section.
Increase the Memory allocated to at least 1 GB.
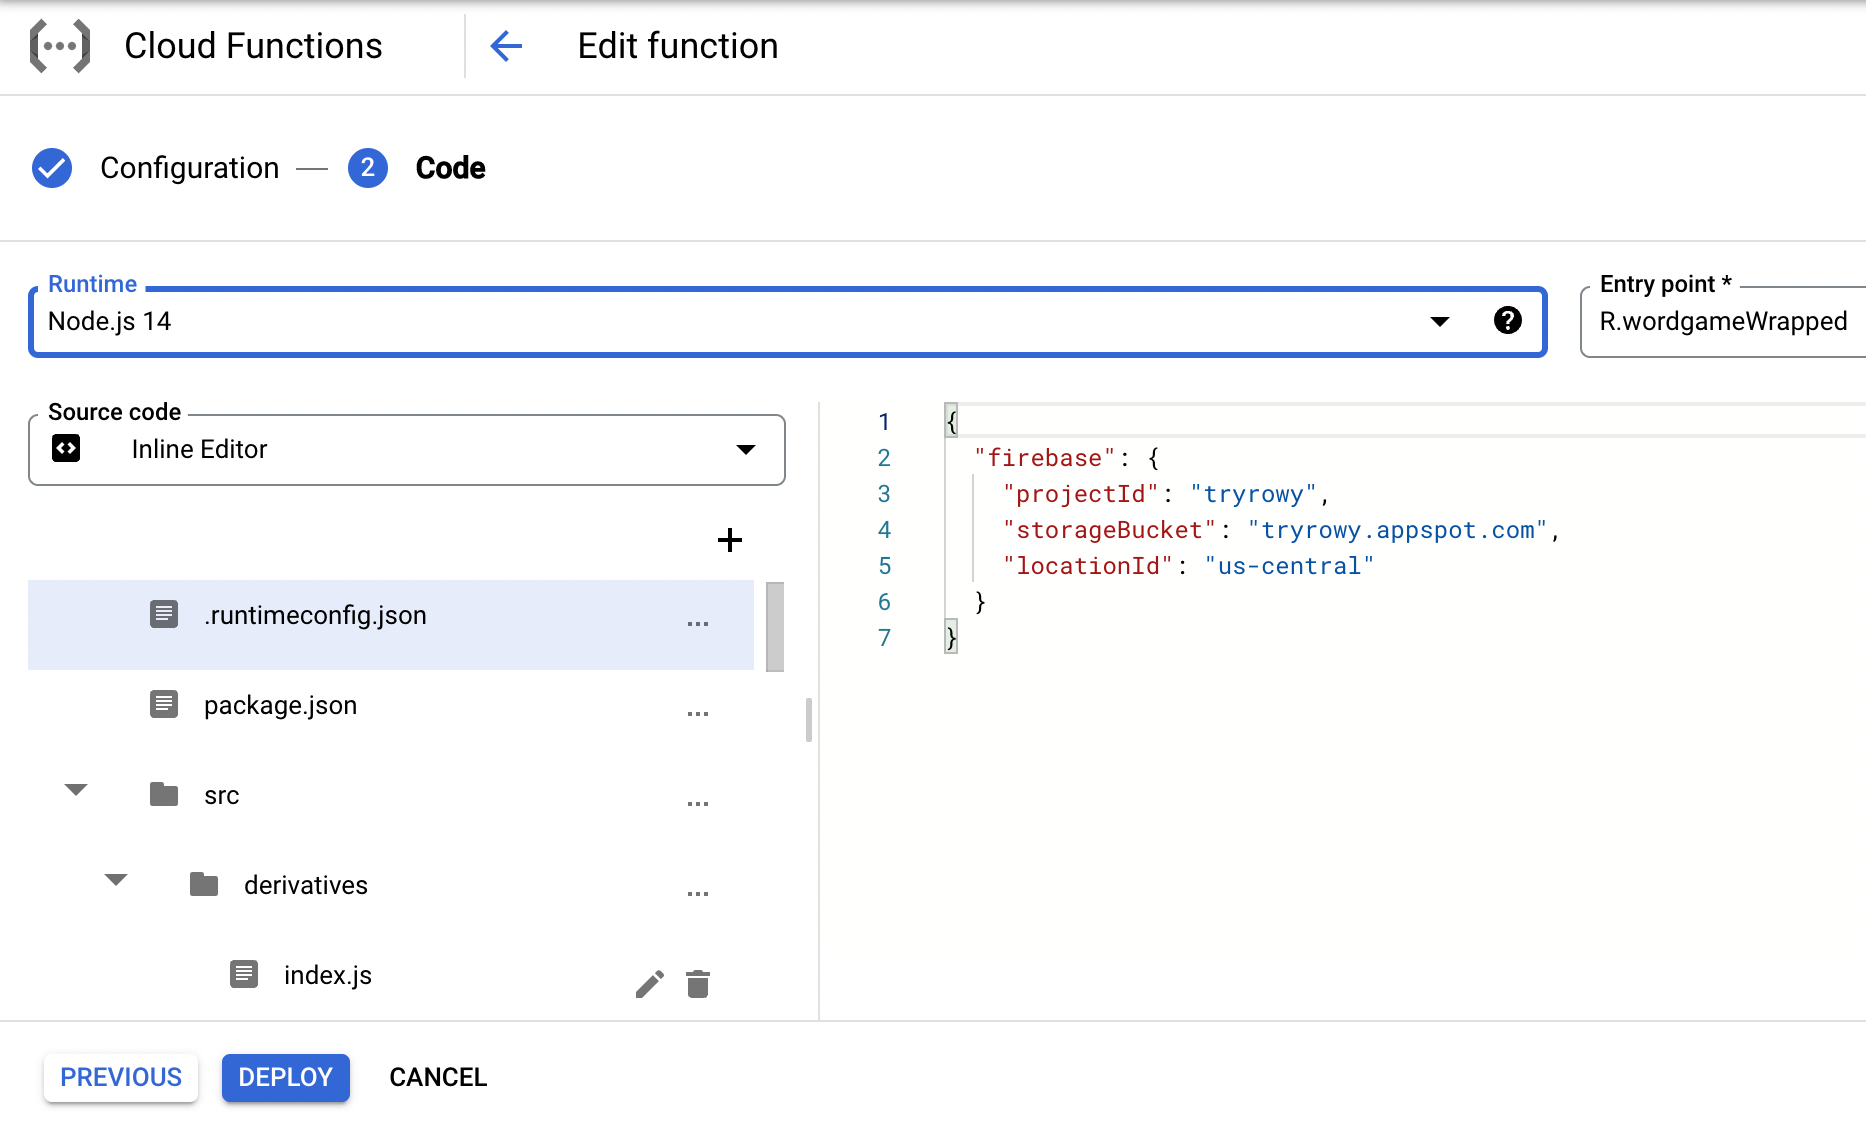
Click Next at the bottom of the screen.

Then, you’ll see the code that’s deployed in your cloud function. When you deploy any function on Rowy, it will be in your Google Cloud or Firebase project, so you have full access and flexibility.
Click Deploy at the bottom of the screen and wait until it’s done. It should take less than five minutes.
Once it’s done, your cloud function will generate images based on data in the row!
Demo
Here’s a demo table that runs the same cloud function above. When you click Add row, it generates random numbers to populate the row. It then generates an image with a random color scheme.